





A cross-platform, agent-native log viewer for reading, parsing, and analyzing various types of logs. Please visit the Website for more details.
跨平台且支援 AI 代理的日誌檢視器,提供多種形式之日誌讀取、解析與分析。請參閱 網站 以取得更多資訊。
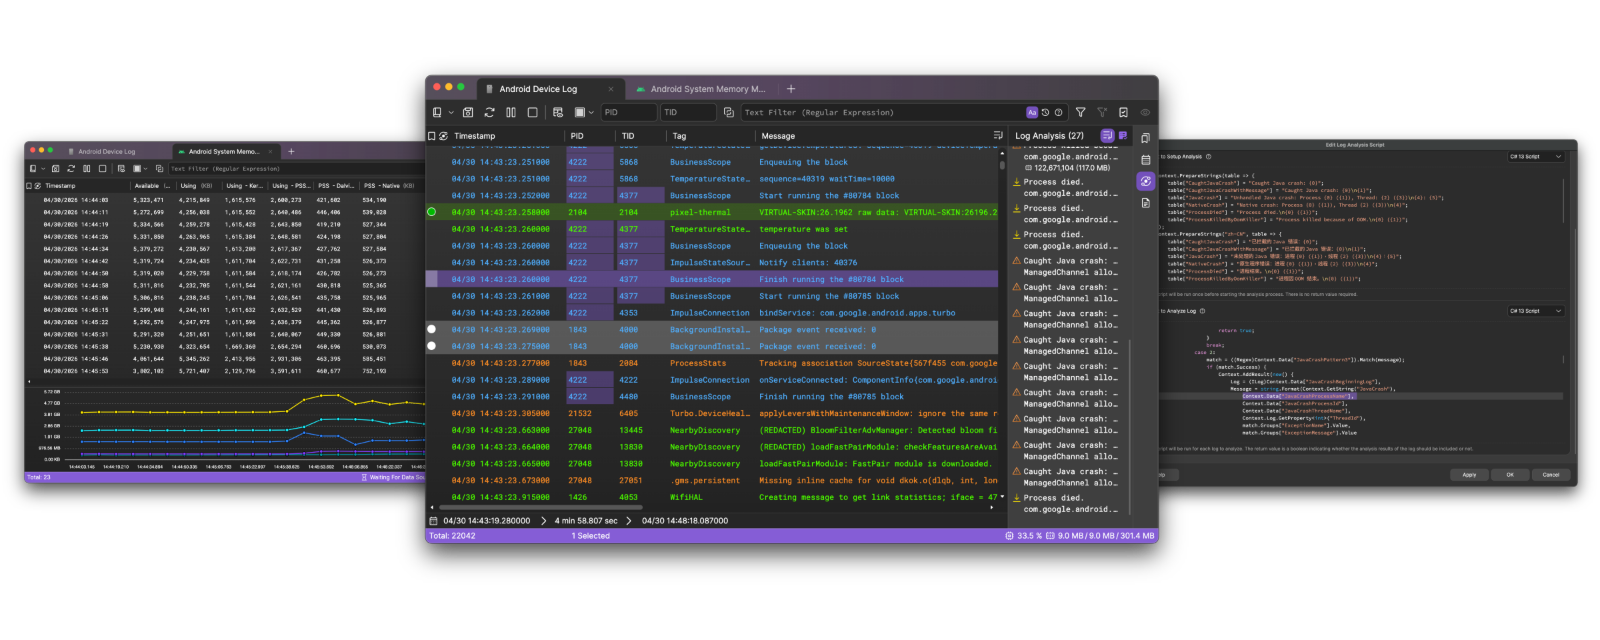
If you encounter failure of upgrading from 2026.1.0 Preview, 2026.1.1 RC, or 2026.1.2 on Windows, please manually close all mcp.exe processes and try again.


-blueviolet?style=for-the-badge)


A log data source reads raw log data into ULogViewer. It can be a file, a network stream, a database, or a script you write.
| Category | Log Data Sources |
|---|---|
| Local | Standard Output (stdout) Files |
| Windows | Windows Event Log Windows Event Log File |
| Network | HTTP/HTTPS TCP (without SSL) UDP |
| Database | SQLite Database MySQL Database ProSQL Server Database Pro |
| Cloud | Azure CLI Pro |
| Script | Log Data Source Script ProEmbedded Log Data Source Script Pro |
Each log profile defines:
- What log data source should be used.
- How to parse log data into structured logs.
- Which properties of the log should be displayed in the list.
- Which properties of the log should be used to generate charts.
Pro - How to output logs back to text (e.g., copying).
Log filtering is one of the most important features in ULogViewer that helps you find and analyze problems from logs. You can filter logs by:
- Text filter defined by a regular expression.
- Level (Priority) of the log.
- Process ID of the log, if available.
- Thread ID of the log, if available.
- Marked logs.
For text filter, you can also predefine some filters you may use frequently and filter logs by combination of these text filters.
When viewing logs, you can mark some logs with different colors which are important for you. There is a separated side panel to list all marked logs to help you to jump to marked log quickly. Marked logs will be kept if you are viewing logs from files so that you don’t need to mark them again when you open log files next time.
Except for log filtering, you can also define rule sets or write scripts to analyze logs. Log analysis runs in the background separately and generates results to a separate side panel. Currently there are 4 types of log analysis supported:
- Key Log Analysis
Find logs with a specific text pattern and level. You can extract information from the log and put it in the result message. - Operation Duration Analysis
Find operations marked by specific starting and ending logs and calculate their duration. You can extract information from the log and put it in the result message. - Operation Counting Analysis
Find operations marked with a specific text pattern and level, then count the number of operations that occurred for each given time frame. You can extract information from the log and put it in the result message. - Log Analysis Script
Write script to analyze logs according to your requirement completely.
Starting from 2026.1, ULogViewer Pro can expose your logs to AI clients through the Model Context Protocol (MCP). You can ask the AI assistant in your client to inspect logs, query tabs, set filters, mark logs and more. The following MCP clients have been verified to work with ULogViewer:
- Claude Code
- Claude Desktop
- Codex
- Cursor
- Gemini CLI
- LM Studio
- Windsurf
MCP access is disabled by default. You can enable it in Options, where you can also control which actions (filtering, marking, selection, window activation) are allowed.
Logs are redacted by Sensitive Data Protection before they leave ULogViewer, masking content such as email addresses and IP addresses. It is applied to MCP responses by default, and its rules can be edited in Options.


