
Top AI Repos — open-source AI, indexed and scored
Top AI Repos tracks AI repositories on GitHub and answers two different questions about each one: is it moving right now, and would you bet a product on it.
Top AI Repos tracks AI repositories on GitHub and answers two different questions about each one: is it moving right now, and would you bet a product on it.

A set of modern Grafana dashboards for Kubernetes.
| Date | Stars |
|---|---|
| 2026-07-24 | 3627 |
| 2026-07-25 | 3627 |
| 2026-07-28 | 3627 |
| 2026-07-30 | 3627 |
| 2026-08-09 | 3638 |
| 2026-08-17 | 3642 |
| 2026-08-21 | 3643 |
| 2026-08-22 | 3645 |
| 2026-08-25 | 3646 |
| 2026-08-26 | 3647 |
| 2026-08-27 | 3648 |
| 2026-08-30 | 3649 |
| 2026-08-31 | 3650 |
| 2026-09-01 | 3654 |
| 2026-09-04 | 3657 |
| 2026-09-07 | 3657 |
| 2026-09-08 | 3658 |
| 2026-09-09 | 3660 |
| 2026-09-11 | 3679 |
| 2026-09-12 | 3718 |
| 2026-09-13 | 3757 |
| 2026-09-14 | 3783 |
| 2026-09-15 | 3789 |
| 2026-09-16 | 3793 |
| 2026-09-17 | 3796 |
| 2026-09-18 | 3798 |
| 2026-09-20 | 3799 |
Today
+1 stars today
This week
+42 stars this week
This month
+156 stars this month
Momentum
1.0
growth rate 1.12%/day
<!-- markdownlint-configure-file { "MD060": { "style": "consistent" } } -->
# grafana-dashboards-kubernetes <!-- omit in toc -->
## Table of contents <!-- omit in toc -->
- [Description](#description)
- [Releases](#releases)
- [Features](#features)
- [Dashboards](#dashboards)
- [Installation](#installation)
- [Install manually](#install-manually)
- [Install via grafana.com](#install-via-grafanacom)
- [Install with ArgoCD](#install-with-argocd)
- [Install with Helm values](#install-with-helm-values)
- [Install as ConfigMaps](#install-as-configmaps)
- [Install as ConfigMaps with Terraform](#install-as-configmaps-with-terraform)
- [Install as GrafanaDashboard with Grafana Operator](#install-as-grafanadashboard-with-grafana-operator)
- [Known issue(s)](#known-issues)
- [Broken panels due to a too-high resolution](#broken-panels-due-to-a-too-high-resolution)
- [Broken panels on k8s-views-nodes when a node changes its IP address](#broken-panels-on-k8s-views-nodes-when-a-node-changes-its-ip-address)
- [Broken panels on k8s-views-nodes due to the nodename label](#broken-panels-on-k8s-views-nodes-due-to-the-nodename-label)
- [Windows support](#windows-support)
- [Contributing](#contributing)
## Description
This repository contains a modern set of [Grafana](https://github.com/grafana/grafana) dashboards for [Kubernetes](https://github.com/kubernetes/kubernetes).\
They are inspired by many other dashboards from `kubernetes-mixin` and `grafana.com`.
More information about them in my article: [A set of modern Grafana dashboards for Kubernetes](https://0xdc.me/blog/a-set-of-modern-grafana-dashboards-for-kubernetes/)
You can also download them on [Grafana.com](https://grafana.com/grafana/dashboards/?plcmt=top-nav&cta=downloads&search=dotdc).
## Releases
This repository follows [semantic versioning](https://semver.org) for releases.\
It relies on [conventional commits](https://www.conventionalcommits.org/en/v1.0.0/) to automate releases using [semantic-release](https://github.com/semantic-release/semantic-release).
## Features
These dashboards are made and tested for the [kube-prometheus-stack](https://github.com/prometheus-community/helm-charts/tree/main/charts/kube-prometheus-stack) chart, but they should work well with others as soon as you have [kube-state-metrics](https://github.com/kubernetes/kube-state-metrics) and [prometheus-node-exporter](https://github.com/prometheus/node_exporter) installed on your Kubernetes cluster.
They are not backward compatible with older Grafana versions because they try to take advantage of Grafana's newest features like:
- `gradient mode` introduced in Grafana 8.1 ([Grafana Blog post](https://grafana.com/blog/2021/09/10/new-in-grafana-8.1-gradient-mode-for-time-series-visualizations-and-dynamic-panel-configuration/))
- `time series` visualization panel introduced in Grafana 7.4 ([Grafana Blog post](https://grafana.com/blog/2021/02/10/how-the-new-time-series-panel-brings-major-performance-improvements-and-new-visualization-features-to-grafana-7.4/))
- `$__rate_interval` variable introduced in Grafana 7.2 ([Grafana Blog post](https://grafana.com/blog/2020/09/28/new-in-grafana-7.2-__rate_interval-for-prometheus-rate-queries-that-just-work/))
They also have a `Prometheus Datasource` variable so they will work on a federated Grafana instance.
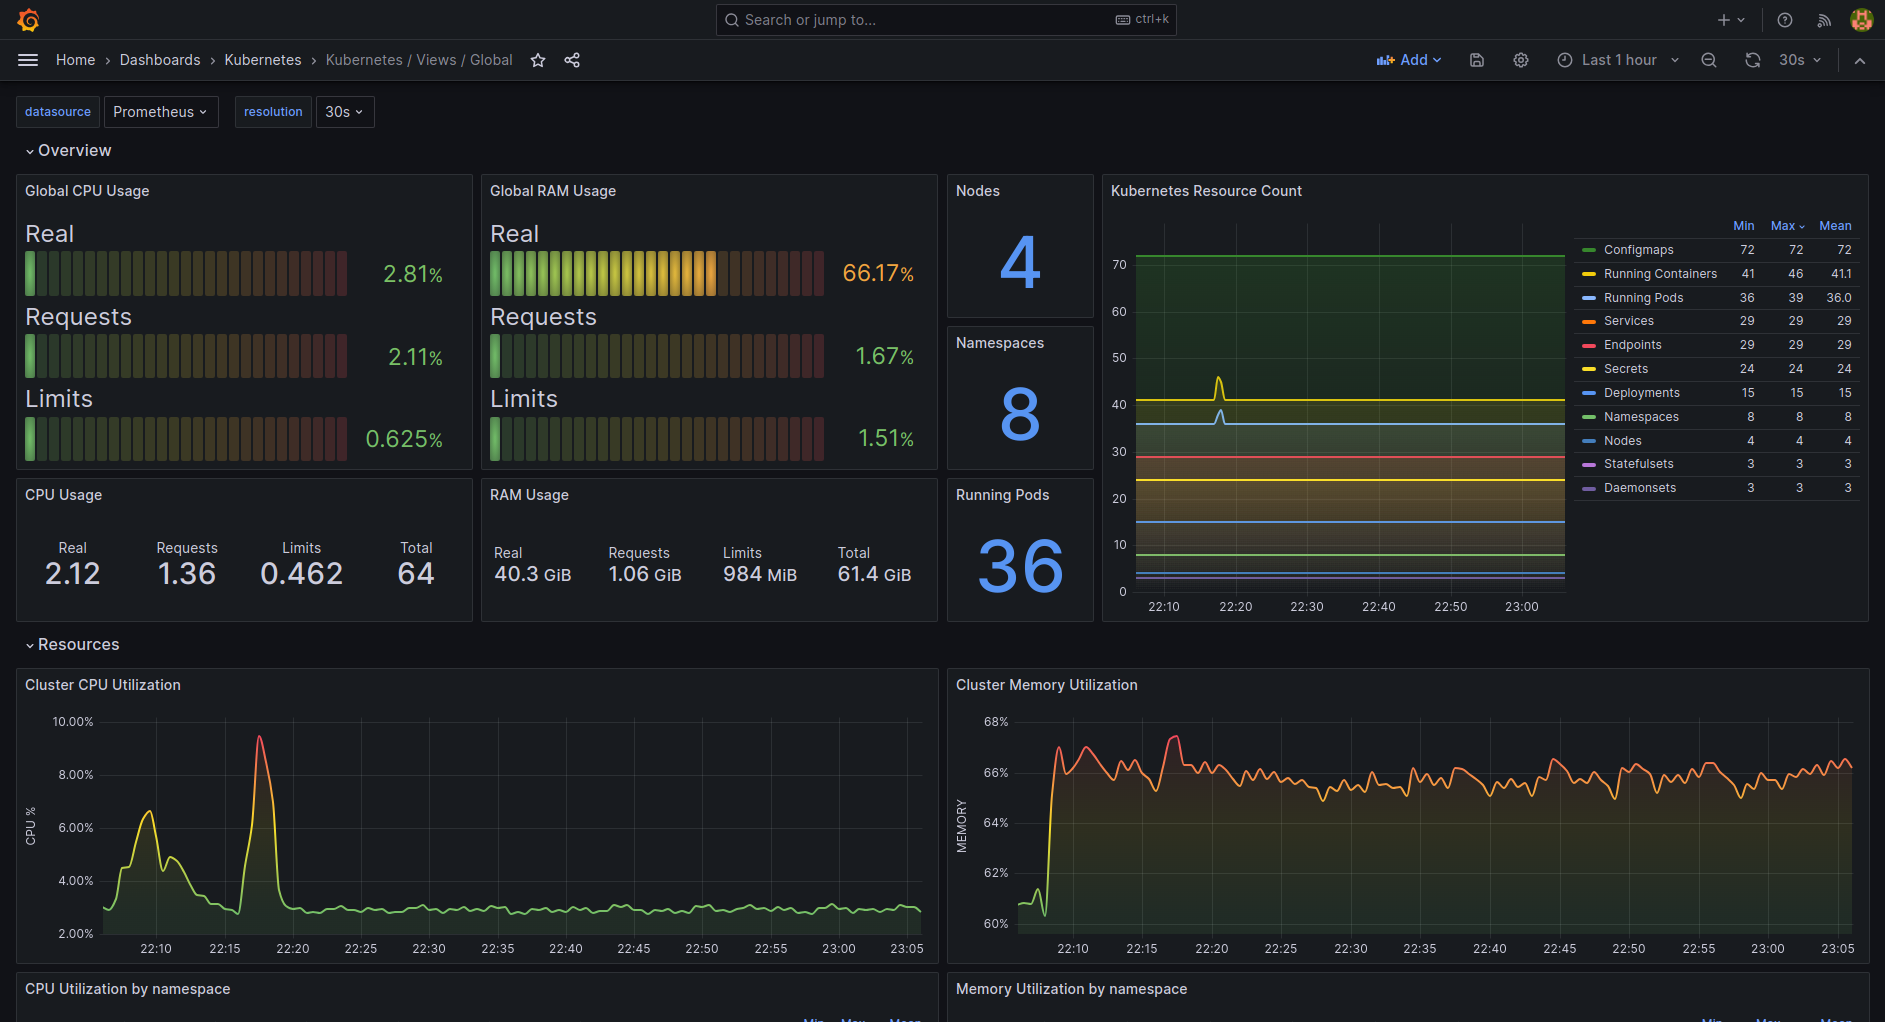
As an example, here's how the `Kubernetes / Views / Global` dashboard looks like:
## Dashboards
| File name | Description | Screenshot |
|:---------------------------|:------------|:----------:|
| k8s-addons-prometheus.json | Dashboard for Prometheus. | [Screenshot](https://raw.githubusercontent.com/dotdc/media/main/grafana-dashboards-kubeExcerpt of 18,407 characters
Read on GitHub
David Calvert · France
253

Thomas · @wiz-sec / @google · United Kingdom
6

3

Marco Franssen · @philips-software · Netherlands
2

2

@flashcatcloud
2

2

2

2

1

1

1

1

1

1

1

1

1

1

Benoît Knecht
1
Would you bet a product on this? Bounded 0–100 and slow moving.
matched fp:742b9992e7602abe, topic:observability, topic:monitoring
matched fp:742b9992e7602abe, topic:kubernetes