



Visit our Kindling website for more information.
Kindling is an eBPF-based cloud native monitoring tool, which aims to help users understand the app behavior from kernel to code stack. With trace profiling, we hope the user can understand the application's behavior easily and find the root cause in seconds. Besides trace profiling, Kindling provides an easy way to get an overview of network flows in the Kubernetes environment, and many built-in network monitor dashboards like TCP retransmit, DNS, throughput, and TPS. Not only as a network monitor, but Kindling is also trying to analyze one detail RPC call and get the following information, which can be found in network explore in chrome. And the usage is the same as network exploration in chrome, with which users can tell which part to dig into to find the root cause of the problem in the production environment.

With traces, metrics, and logs, many issues still can’t be understood easily. Trace-profiling is trying to integrate the OnCPU and OffCPU events within the traces and collect the logs output during the trace execution timeframe.
OnCPU events are just like the flame graph, but the code has been collected at the thread level instead of the process level. And the trace was executed by one thread, so users can understand how the trace was executing on the CPU.
OffCPU events are the opposite of OnCPU events. As for the trace analysis, most traces spend a lifetime waiting for the locks, database query, remote process call, file reading, or file writing. All of these events cause the thread in waiting status, and they are considered as OffCPU events.
So for trace profiling, how all threads were executed is recorded and can be replayed.
- The exact thread which executed the trace span is highlighted.
- The logs printed by each thread are collected and correlated to the relative thread with its timestamp.
- The code execution flame graph is correlated to the time series where the CPU is busy.
- The network-related metrics are correlated to the time series where the network syscalls are executing.
- The file-related metrics are correlated to the time series where the file syscalls are executing.
From a high-level view, the agent runs as DeamonSet in Kubernetes. It collects all syscalls and some other tracepoints. We use different exporters for different distributions. For example, we build a Prometheus exporter to export the data which can be stored in Prometheus and displayed in Grafana Plugin. But for the trace profiling module, the UI is different, that's a standalone module.

The Kindling eBPF module depends on the kernel version which is newer than 4.14. But for trace-profiling, the kernel version has to be newer than 4.17, hoping with more work, the trace-profiling can work on older kernel versions. As an eBPF constraint, the eBPF module can't work for older kernel versions. But for the users who want to try the functionality with the old kernel, we use the kernel module from Sysdig open-source project with enhancement and verification. Basically, the idea is to use a kernel module for tracking the kernel tracepoints. Thanks to Sysdig open-source project, it provides a tracepoint instrument framework for older kernel versions.
For now, the kernel module works as expected as the eBPF module during our test except for trace-profiling, but it is recommended to use the eBPF module in the production environment as it is safer than the kernel module. In order to help the older kernel version user experience the eBPF magic, we also support the kernel model. And you are welcome to report issues with the kernel module. For functionality, the kernel module and eBPF module capture the same data and behave exactly the same.
When we talk about observability, we already have plenty of tools to use, like Skywalking for tracing, ELK for logging, and Prometheus for metrics. Why do we need to build an eBPF-based monitoring tool?
The majority issue for user adoption of k8s is the complexity. For the applications on Kubernetes, we don't know the network flows between the services until we can instrument the apps. We can't tell which part to blame when there is a product issue arise. Do we configure Kubernetes correctly? Are there any bugs in the virtual network like Calico or Flannel that caused this problem? Does the application code cause this issue?
We are a company based in Hangzhou, China, and used to provide Kubernetes distribution for our customers. Our customers used to have those questions, and we don't have proper solutions to answer those questions.
APM(Application Performance Monitoring) is good for those applications in Java which can be instrumented automatically, while for the Go programs, the code has to be rewritten for instrumenting. And even if we adopt the APM solution, we still can't tell whether an issue is caused by network problems, and many issues can’t be pinpoint the root cause easily.
We found it may be helpful that we triage the issue first by checking the issue from the network view to identify issues roughly like "oh, it's a network problem, the code works fine, and we should dig into the configuration of calico" or "the infrastructure works fine, so the app code should be blamed, let's dig into the logs or the APM dashboard for further information".
After we triage the issue, we need to pinpoint the root cause of the issue. That's why we need the trace-profiling module.
The libpcap way of analyzing the flows in the Kubernetes environment is too expensive for the CPU and network. The eBPF way of data capture cost much less than libpcap. eBPF is the most popular technology to track the Linux kernel where the virtual network, built by veth-pair and iptables, works. So eBPF is a proper technique to be used for tracking how the kernel responds to application requests.
With the trace-profiling module, we can understand how ElasticSearch works easily. The following image shows how ElasticSearch is executing the bulk insert operation.

The next image shows a dependency map in Kubernetes.
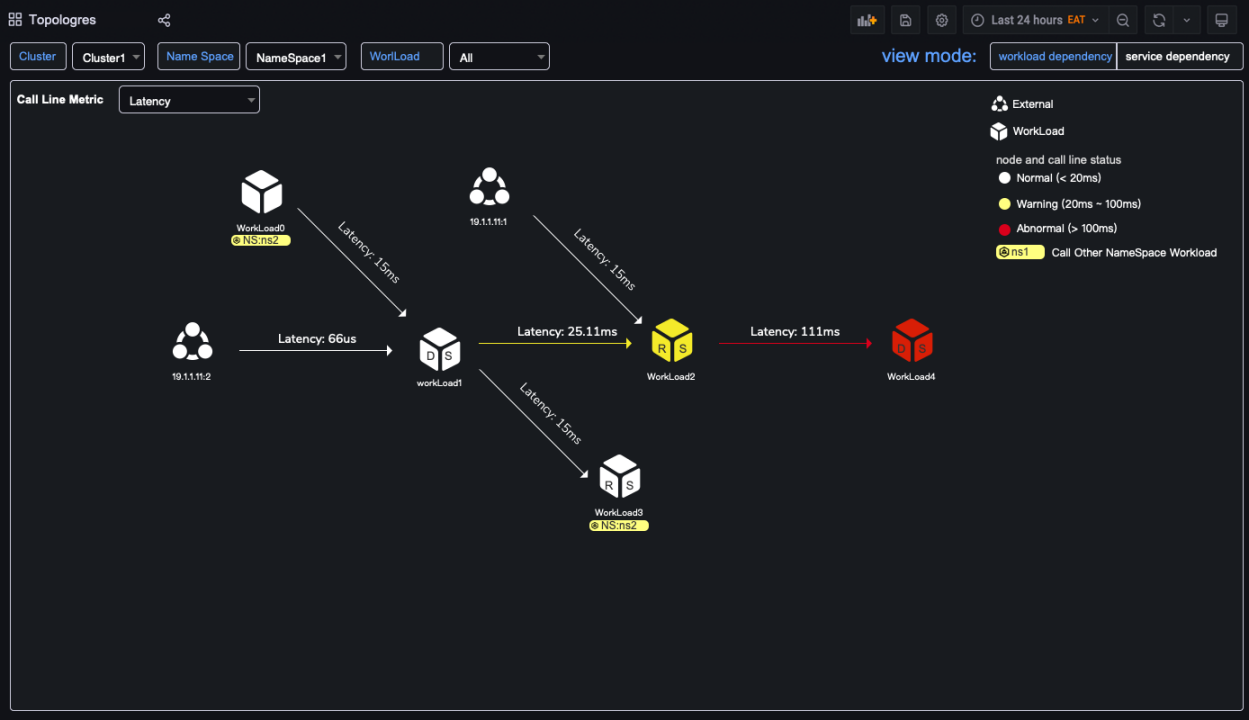
Kindling can be easily integrated with Prometheus, and we uses PromQL to query the data in the frontend, so it should be adopted easily. But due to the cardinality constraint of Prometheus, we group the detailed data into buckets which throw away the detailed information.
You can deploy Kindling easily, check out the Installation Guide for details.
The Kindling documentation is available on our Kindling website
Contributions are welcome, you can contribute in many ways: report issues, help us reproduce issues, fix bugs, add features, give us advice on GitHub discussion, and so on. If you are interested in joining us to unveil the eBPF in the Kubernetes area, you can start by reading the Contributing Guide.
If you have questions or ideas, please feel free to reach out to us in the following ways:
- Check out the discussions
- Join the Kindling Slack channel
- Join the WeChat Group (in Chinese)

Kindling is distributed under Apache License, Version2.0.


