

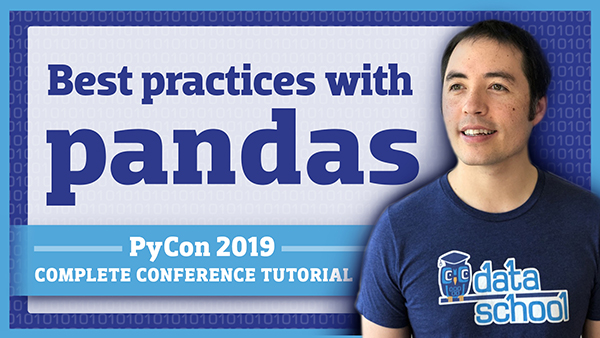
This tutorial was presented by Kevin Markham at PyCon on May 2, 2019. Watch the complete tutorial video on YouTube.
The tutorial code is available as a Jupyter notebook. You can run this notebook in the cloud (no installation required) by clicking the "launch binder" button:

The pandas library is a powerful tool for multiple phases of the data science workflow, including data cleaning, visualization, and exploratory data analysis. However, the size and complexity of the pandas library makes it challenging to discover the best way to accomplish any given task.
In this tutorial, you'll use pandas to answer questions about a real-world dataset. Through each exercise, you'll learn important data science skills as well as "best practices" for using pandas. By the end of the tutorial, you'll be more fluent at using pandas to correctly and efficiently answer your own data science questions.
You will get the most out of this tutorial if you are an intermediate pandas user, since the tutorial does not cover pandas basics.
- If you are new to pandas, I recommend watching some videos from my free pandas course before the tutorial.
- If you just need a pandas refresher, I recommend reviewing this Jupyter notebook, which includes all of the code from my pandas course.
ted.csv is the TED Talks dataset from Kaggle Datasets, made available under the CC BY-NC-SA 4.0 license.
Here are three options that will work equally well:
- If you want to directly download only the CSV file, right click on the following link and select "Save As":
ted.csv. - If you know how to use git, you can click the green button above and clone the entire repository.
- If you know how to open a ZIP file, you can click the green button above and download the entire repository.
- Make sure that pandas and matplotlib are installed on your computer. (The easiest way to install pandas and matplotlib is by downloading the Anaconda distribution.)
- Download the CSV file from this repository.
- Read the file into pandas using the
read_csv()function to make sure everything is working.
-
Move the CSV file into your working directory. (This is usually the directory where you create Python scripts or notebooks.)
-
Open the Python environment of your choice.
-
If you're using the Jupyter notebook, run the following code:
import pandas as pd
import matplotlib.pyplot as plt
%matplotlib inline
ted = pd.read_csv('ted.csv')
ted.comments.plot()
-
If you're using any other Python environment, run the following code:
import pandas as pd
import matplotlib.pyplot as plt
ted = pd.read_csv('ted.csv')
ted.comments.plot()
plt.show()
If you don't get any error messages, and a plot appears on your screen, then it's very likely that pandas and matplotlib are installed correctly.
Kevin Markham is the founder of Data School, an online school for learning data science with Python. He is passionate about teaching data science to people who are new to the field, regardless of their educational and professional backgrounds. Previously, Kevin was the lead data science instructor for General Assembly in Washington, DC. Currently, he teaches machine learning and data analysis to over 10,000 students each month through the Data School YouTube channel. He has a degree in Computer Engineering from Vanderbilt University and lives in Asheville, North Carolina with his wife and son.
