
Top AI Repos — open-source AI, indexed and scored
Top AI Repos tracks AI repositories on GitHub and answers two different questions about each one: is it moving right now, and would you bet a product on it.
Top AI Repos tracks AI repositories on GitHub and answers two different questions about each one: is it moving right now, and would you bet a product on it.

Docker hosts and containers monitoring with Prometheus, Grafana, cAdvisor, NodeExporter and AlertManager
| Date | Stars |
|---|---|
| 2026-07-24 | 6573 |
| 2026-07-25 | 6573 |
| 2026-07-28 | 6573 |
| 2026-07-30 | 6573 |
| 2026-08-09 | 6573 |
| 2026-08-17 | 6574 |
| 2026-08-19 | 6575 |
| 2026-08-21 | 6576 |
| 2026-08-22 | 6575 |
| 2026-08-25 | 6576 |
| 2026-08-26 | 6576 |
| 2026-08-28 | 6575 |
| 2026-08-29 | 6574 |
| 2026-08-30 | 6575 |
| 2026-09-02 | 6574 |
| 2026-09-04 | 6576 |
| 2026-09-05 | 6575 |
| 2026-09-06 | 6576 |
| 2026-09-09 | 6576 |
| 2026-09-11 | 6577 |
| 2026-09-15 | 6577 |
| 2026-09-16 | 6577 |
| 2026-09-20 | 6577 |
Today
— stars today
This week
— stars this week
This month
+1 stars this month
Momentum
0.0
growth rate 0.00%/day
# dockprom
A monitoring solution for Docker hosts and containers with [Prometheus](https://prometheus.io/), [Grafana](http://grafana.org/), [cAdvisor](https://github.com/google/cadvisor),
[NodeExporter](https://github.com/prometheus/node_exporter) and alerting with [AlertManager](https://github.com/prometheus/alertmanager).
## Install
Clone this repository on your Docker host, cd into dockprom directory and run compose up:
```bash
git clone https://github.com/stefanprodan/dockprom
cd dockprom
ADMIN_USER='admin' ADMIN_PASSWORD='admin' ADMIN_PASSWORD_HASH='$2a$14$1l.IozJx7xQRVmlkEQ32OeEEfP5mRxTpbDTCTcXRqn19gXD8YK1pO' docker-compose up -d
```
**Caddy v2 does not accept plaintext passwords. It MUST be provided as a hash value. The above password hash corresponds to ADMIN_PASSWORD 'admin'. To know how to generate hash password, refer [Updating Caddy to v2](#Updating-Caddy-to-v2)**
Prerequisites:
* Docker Engine >= 1.13
* Docker Compose >= 1.11
## Updating Caddy to v2
Perform a `docker run --rm caddy caddy hash-password --plaintext 'ADMIN_PASSWORD'` in order to generate a hash for your new password.
ENSURE that you replace `ADMIN_PASSWORD` with new plain text password and `ADMIN_PASSWORD_HASH` with the hashed password references in [docker-compose.yml](./docker-compose.yml) for the caddy container.
Containers:
* Prometheus (metrics database) `http://<host-ip>:9090`
* Prometheus-Pushgateway (push acceptor for ephemeral and batch jobs) `http://<host-ip>:9091`
* AlertManager (alerts management) `http://<host-ip>:9093`
* Grafana (visualize metrics) `http://<host-ip>:3000`
* NodeExporter (host metrics collector)
* cAdvisor (containers metrics collector)
* Caddy (reverse proxy and basic auth provider for prometheus and alertmanager)
## Setup Grafana
Navigate to `http://<host-ip>:3000` and login with user ***admin*** password ***admin***. You can change the credentials in the compose file or by supplying the `ADMIN_USER` and `ADMIN_PASSWORD` environment variables on compose up. The config file can be added directly in grafana part like this
```yaml
grafana:
image: grafana/grafana:7.2.0
env_file:
- config
```
and the config file format should have this content
```yaml
GF_SECURITY_ADMIN_USER=admin
GF_SECURITY_ADMIN_PASSWORD=changeme
GF_USERS_ALLOW_SIGN_UP=false
```
If you want to change the password, you have to remove this entry, otherwise the change will not take effect
```yaml
- grafana_data:/var/lib/grafana
```
Grafana is preconfigured with dashboards and Prometheus as the default data source:
* Name: Prometheus
* Type: Prometheus
* Url: [http://prometheus:9090](http://prometheus:9090)
* Access: proxy
***Docker Host Dashboard***
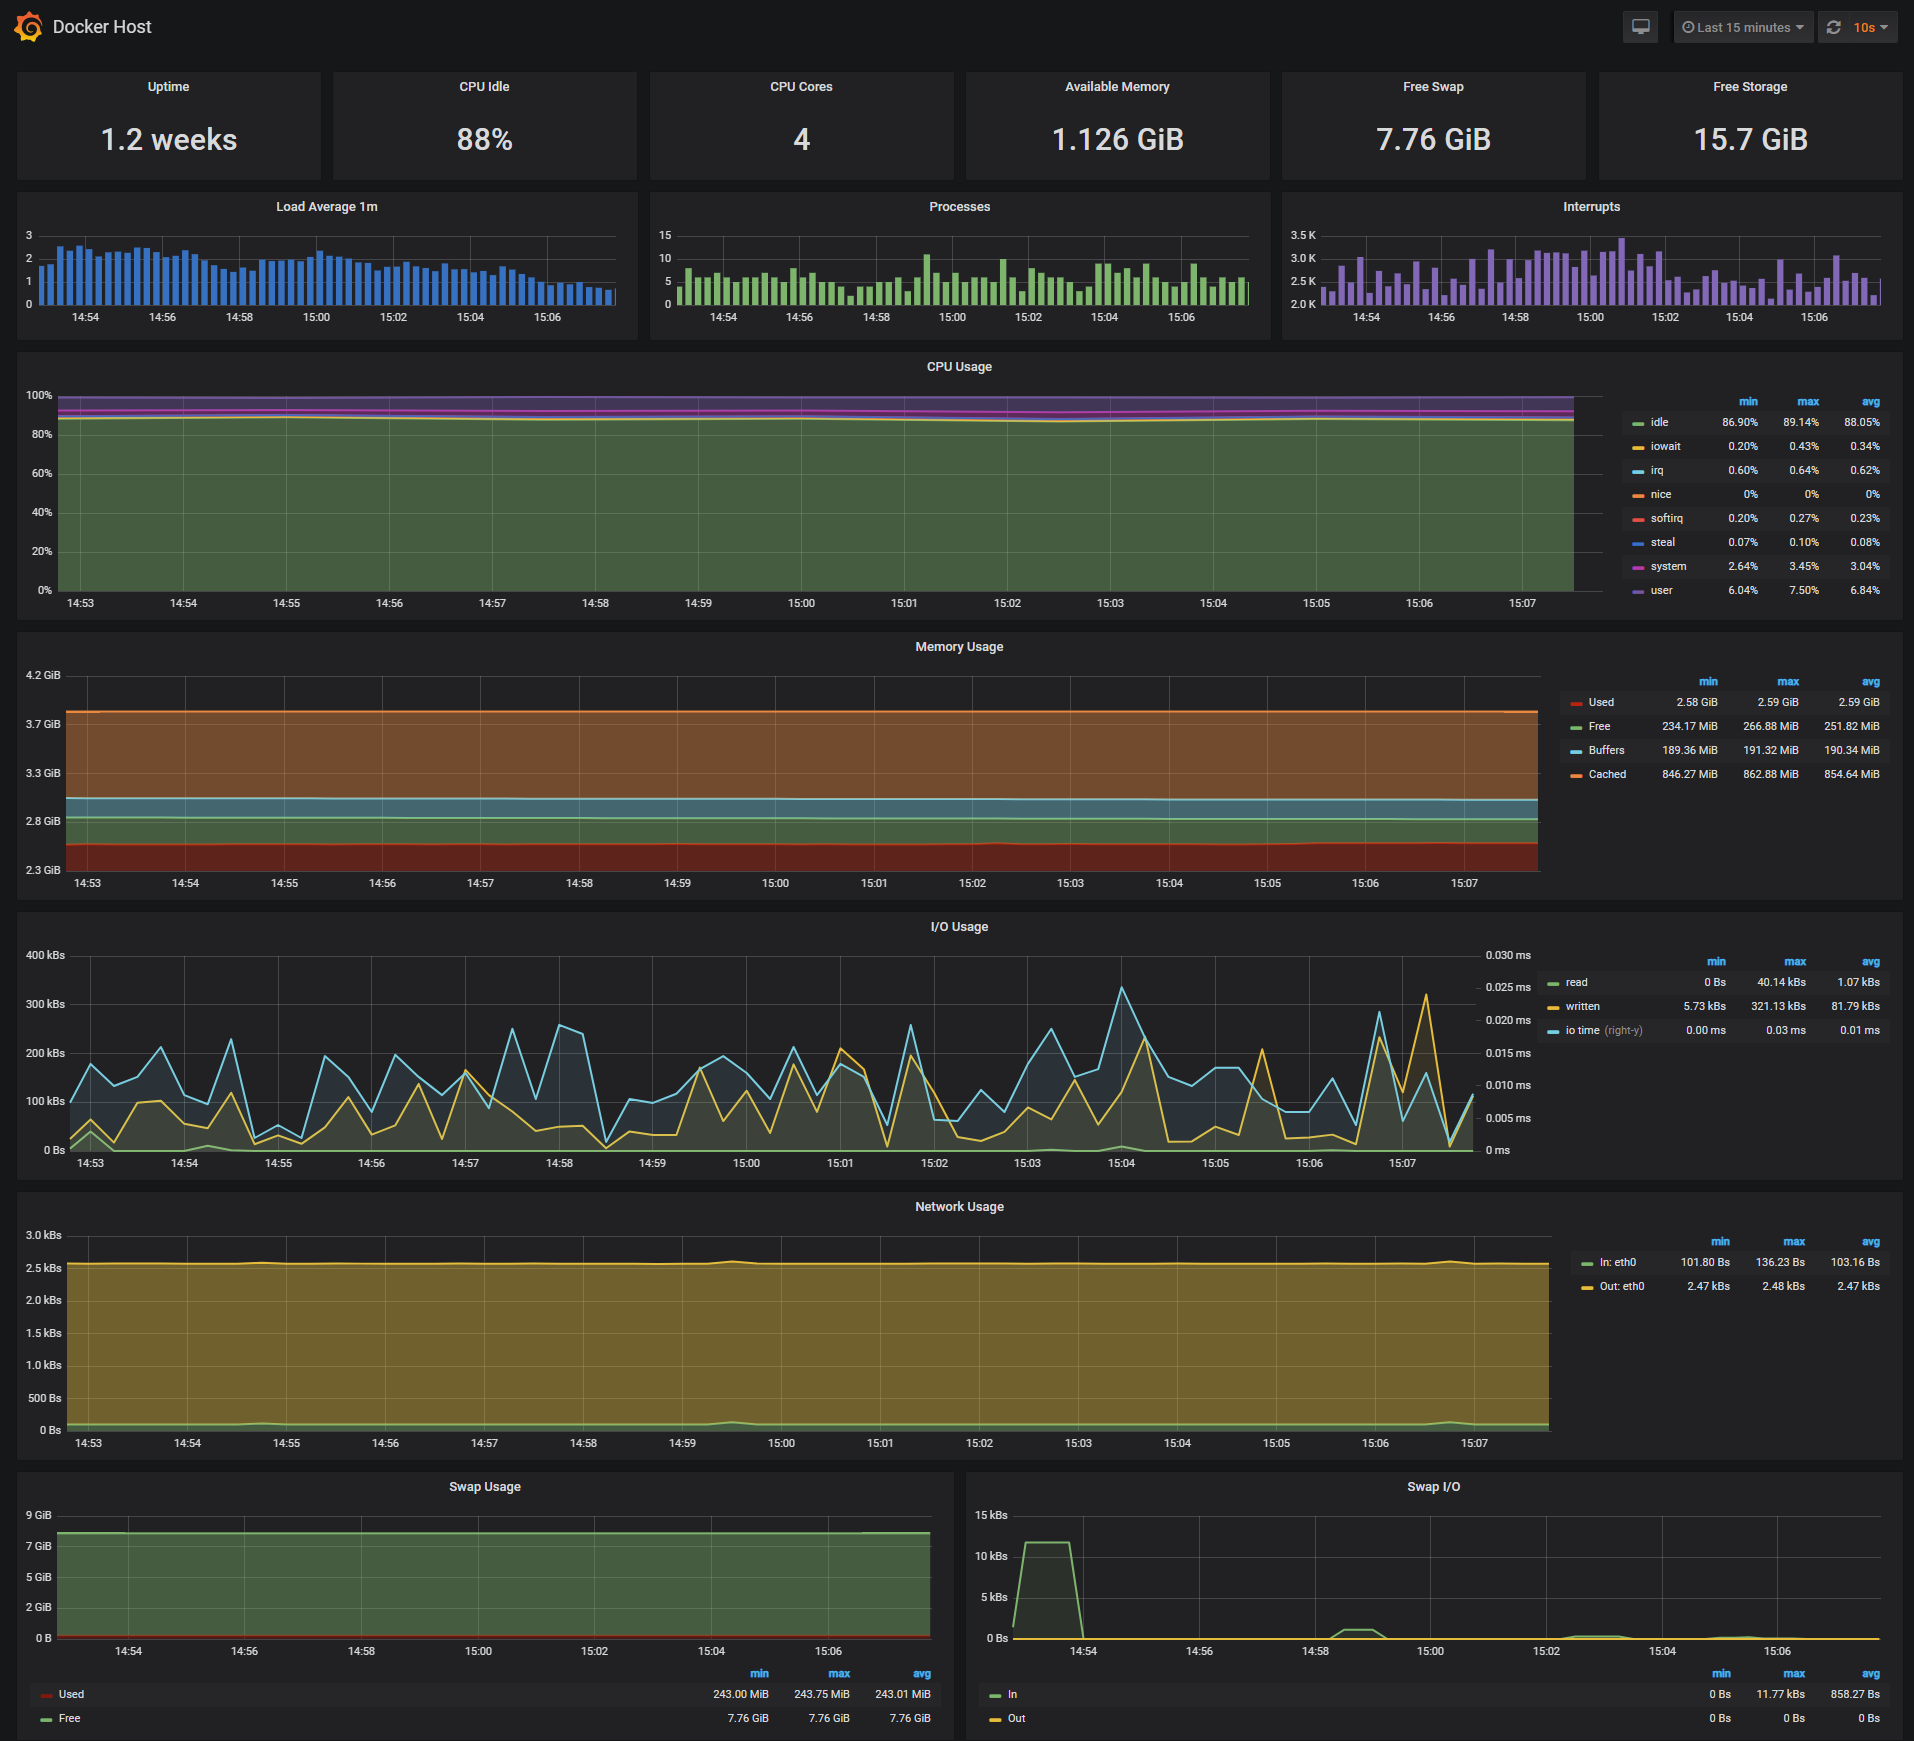
The Docker Host Dashboard shows key metrics for monitoring the resource usage of your server:
* Server uptime, CPU idle percent, number of CPU cores, available memory, swap and storage
* System load average graph, running and blocked by IO processes graph, interrupts graph
* CPU usage graph by mode (guest, idle, iowait, irq, nice, softirq, steal, system, user)
* Memory usage graph by distribution (used, free, buffers, cached)
* IO usage graph (read Bps, read Bps and IO time)
* Network usage graph by device (inbound Bps, Outbound Bps)
* Swap usage and activity graphs
For storage and particularly Free Storage graph, you have to specify the fstype in grafana graph request.
You can find it in `grafana/provisioning/dashboards/docker_host.json`, at line 480 :
```yaml
"expr": "sum(node_filesystem_free_bytes{fstype=\"btrfs\"})",
```
I work on BTRFS, so i need to change `aufs` to `btrfs`.
You can find right value for your system in Prometheus `http://<host-ip>:9090` launching this request :
```yaml
node_filesystem_free_bytes
```
***Docker Containers Dashboard***
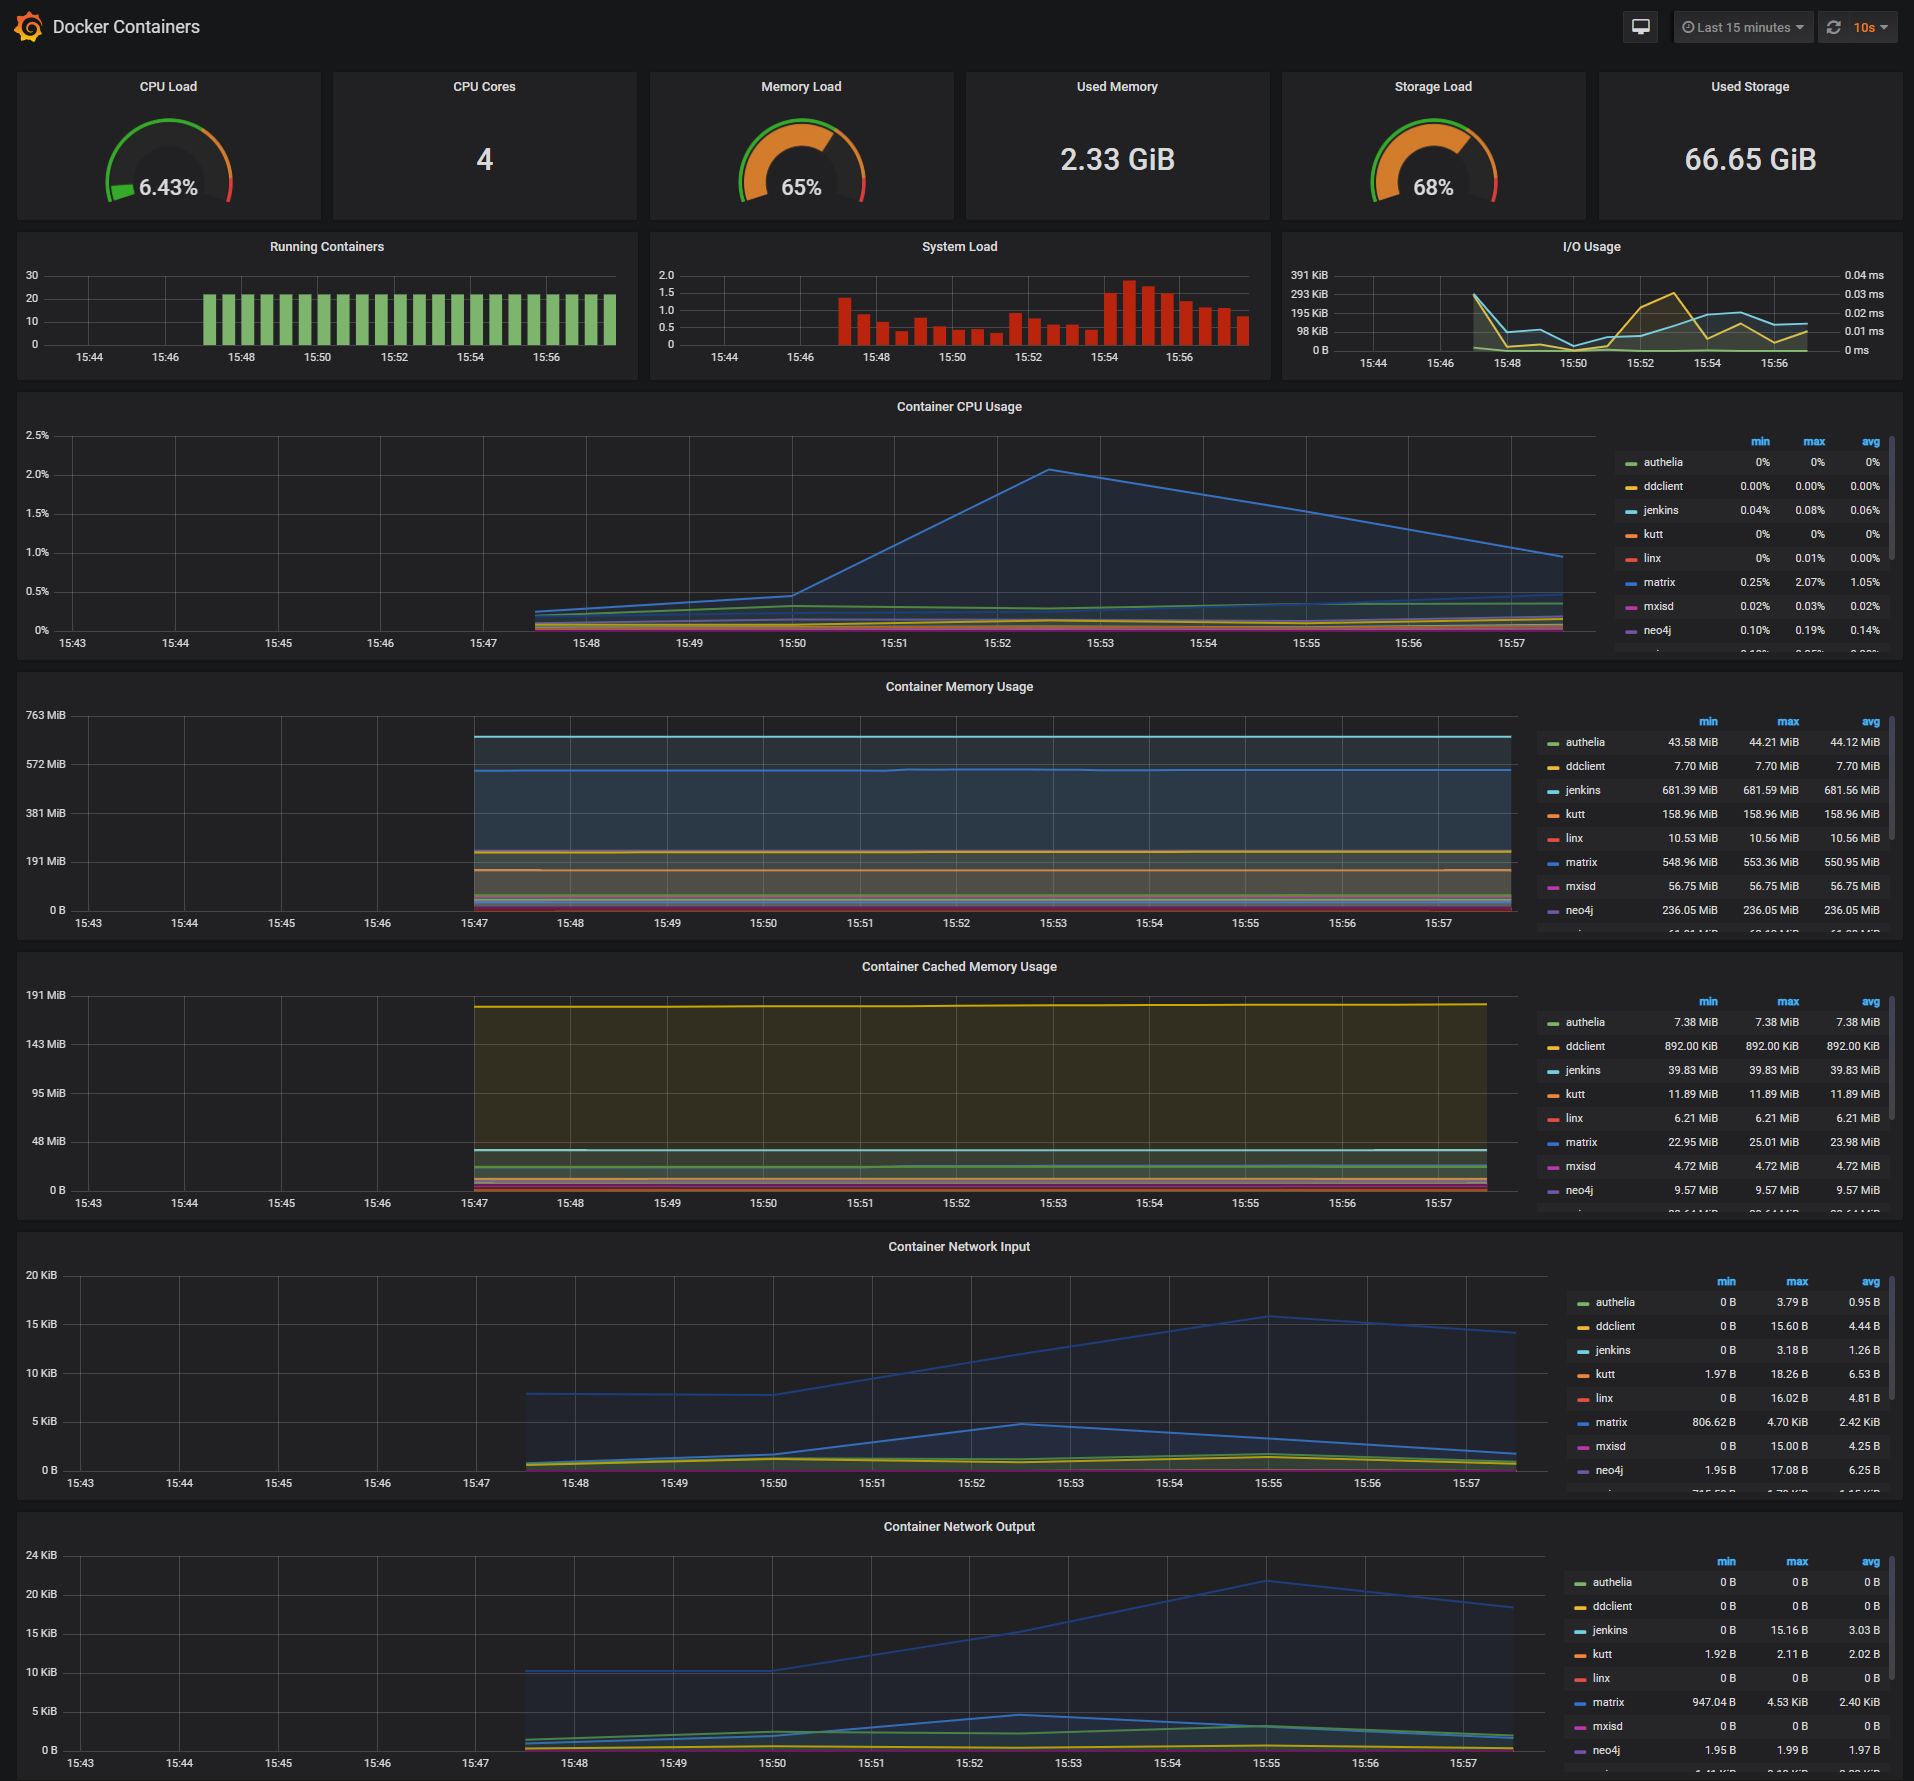
TheExcerpt of 13,919 characters
Read on GitHub
312

Stefan Prodan · @controlplaneio
92

5

3

Scott Brenner · United States
3

2

2

2

2

1

1

1

Bo-Yi Wu · Mediatek · Taiwan
1

1

Pascal Andy · https://pascalandy.com
1

Ben Szabo · United Kingdom
1

1

1

1

Guy Khmelnitsky · BigPanda · Israel
1
Would you bet a product on this? Bounded 0–100 and slow moving.
matched fp:2997cbf224bc988e, topic:monitoring